One of the striking differences between Windows and macOS is the rarity of advanced system tools on the latter. For example, the family of Sysinternals tools on Windows provide invaluable information to people trying to diagnose and investigate complicate issues on their machines.
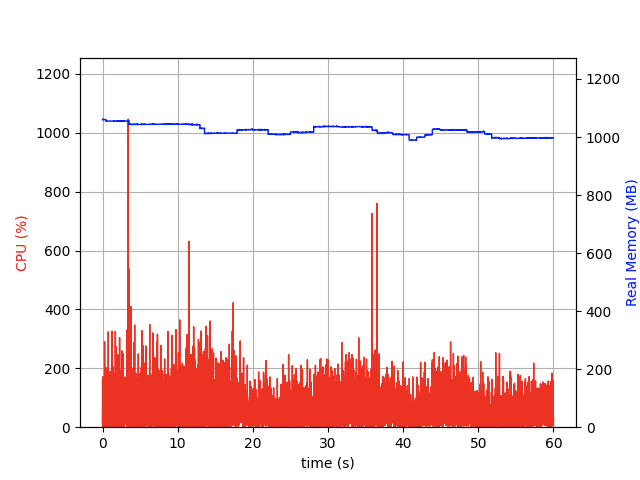
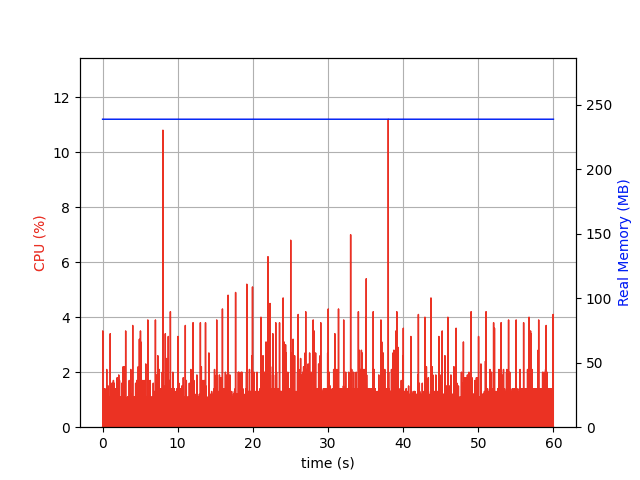
A few days ago, I found myself needing to collect the CPU and Memory usage information of applications over an extended period. I needed the data to troubleshoot some troubles I was facing with a security product I am using to protect my machine. There were multiple performance anomalies, and it was starting to interrupt my daily work. In this post, I share with you a brilliant tool that can assist you in collecting this data and plotting it in an easy-to-consume graph.
psrecord
psrecord is a small utility that uses the psutil library to record the CPU and memory activity of a process. The package is still under development and is therefore experimental.
Requirements
The tool has few requirements, those are:
- Python 2.7 or 3.3 and higher
- psutil 1.0 or later
- matplotlib
You can install the requirements by running the following commands:
pip3 install psutil
pip3 install matplotlib
Installation
You can install psrecord using the following command:
pip3 install psrecordUsage
This tool can be used in a variety of configurations, depending on what you want to achieve. Some examples are:
Record CPU and memory usage for a specified interval
psrecord 1330 --log activity.txt --duration 60Include all the children processes
psrecord 1330 --log activity.txt --include-childrenAdjust the time intervals at which data is polled.
psrecord 1330 --log activity.txt --interval 2Store the data to a file or plot it in a graph.
psrecord 1330 --log activity.txt --plot plot.png


