

Okta keeps logs for 90 days (or at least that's how long you as a customer can access them) before rotating them. This is a rather short period and can cause serious issues when investigating malicious activities (or internal security incidents at Okta). Luckily for everyone, Okta recently released a Log Streaming feature to their Beta channel. The feature allows you to ship Okta logs to one of two destination – for now – AWS EventBridge, and Splunk Cloud.
"Log data older than 3 months is not accessible in the System Log." (Source)
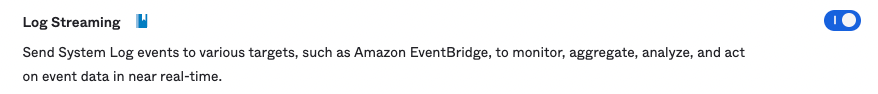
Activate The Log Streaming Feature
The Log Streaming feature is still in Early Access stage, which means you will need to enable manually for your Okta Tenant.
- Log into your Okta tenant.
- Navigate to the admin section.
- Go to Settings → Features
- Toggle on the button next to the Log Streaming feature to enable it.
Stream Okta Logs To AWS EventBridge
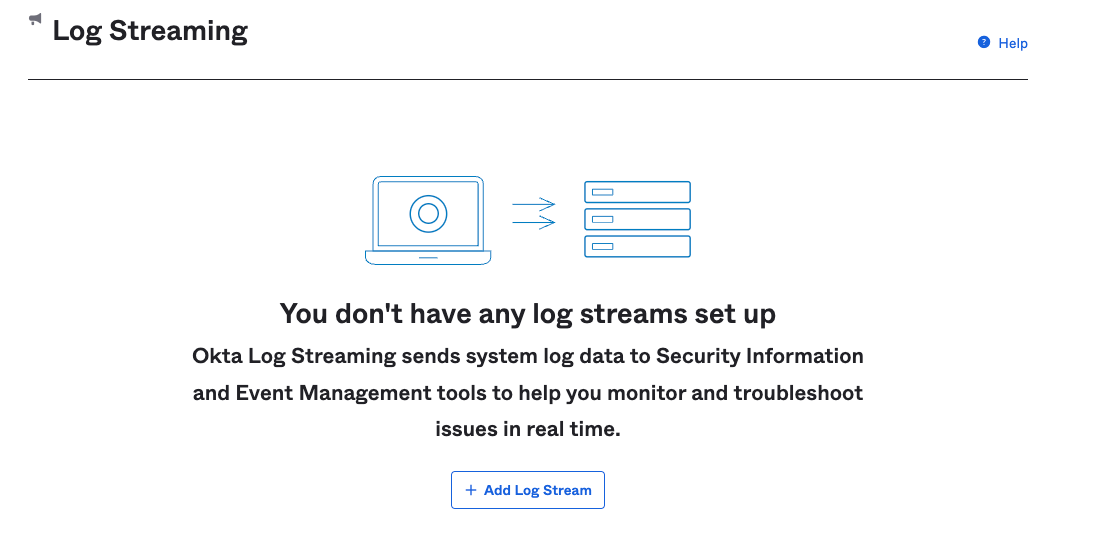
Once Log Stream is activated, we can now configure it to send the logs to AWS EventBridge Or Splunk Cloud (the only two supported targets for now).
- Navigate to Reports → Log Streaming and click on Add Log Stream
- In the first configuration pane, you need to select a type for the log stream. You will have only one choice, select it and proceed.

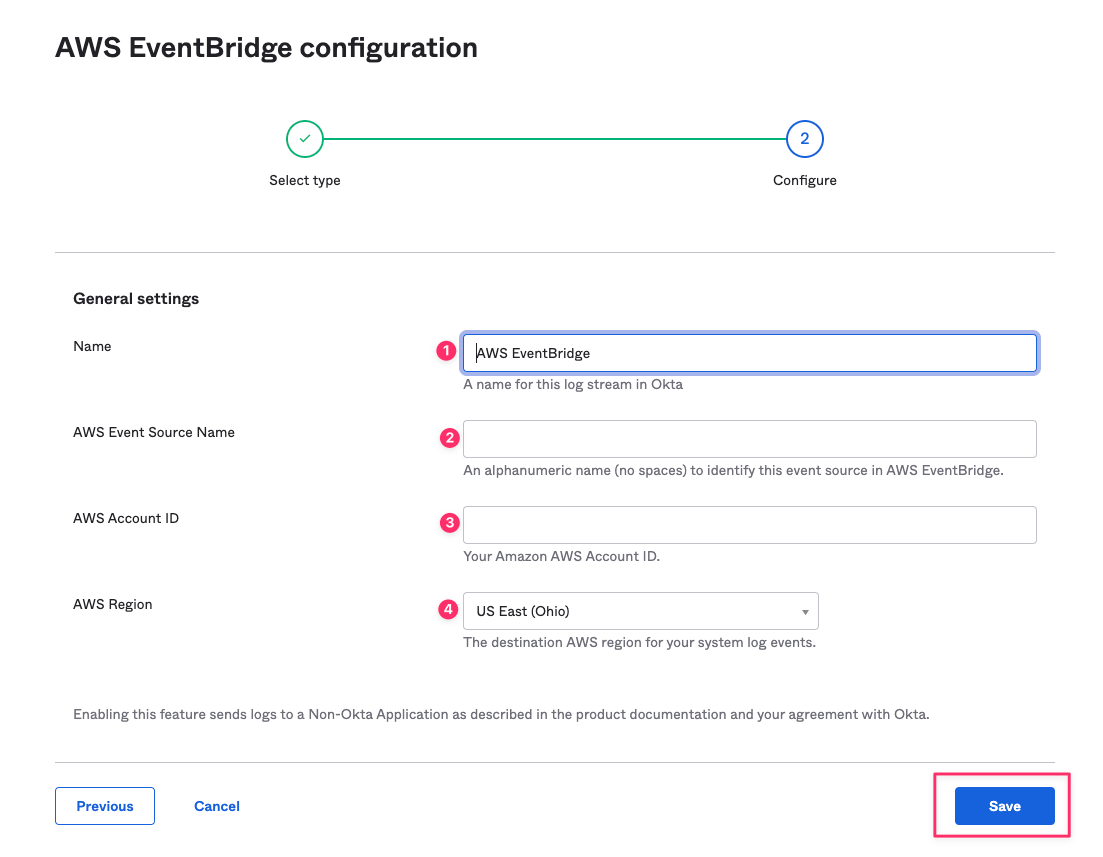
- In the second configuration pane, you will have to enter a name for the log stream, your AWS account ID, and the AWS region where the new log stream will be created, and a source name that will be used to differentiate the log source on AWS EventBridge. Click Save, and you are done.
Set Up Things On AWS Event Bridge
- Login into the AWS account that you configured in the previous step and navigate to the AWS EventBridge Service.
- Navigate to Partner event sources. If you configured things on Okta correctly, you should see a source named http://aws.partner/okta.com/<okta-tenant-name>/<AWSEventSourceName> that's in a pending status.
- Select the source and click on Associate with event bus. Click through the steps until the source is associated with a new event bus.
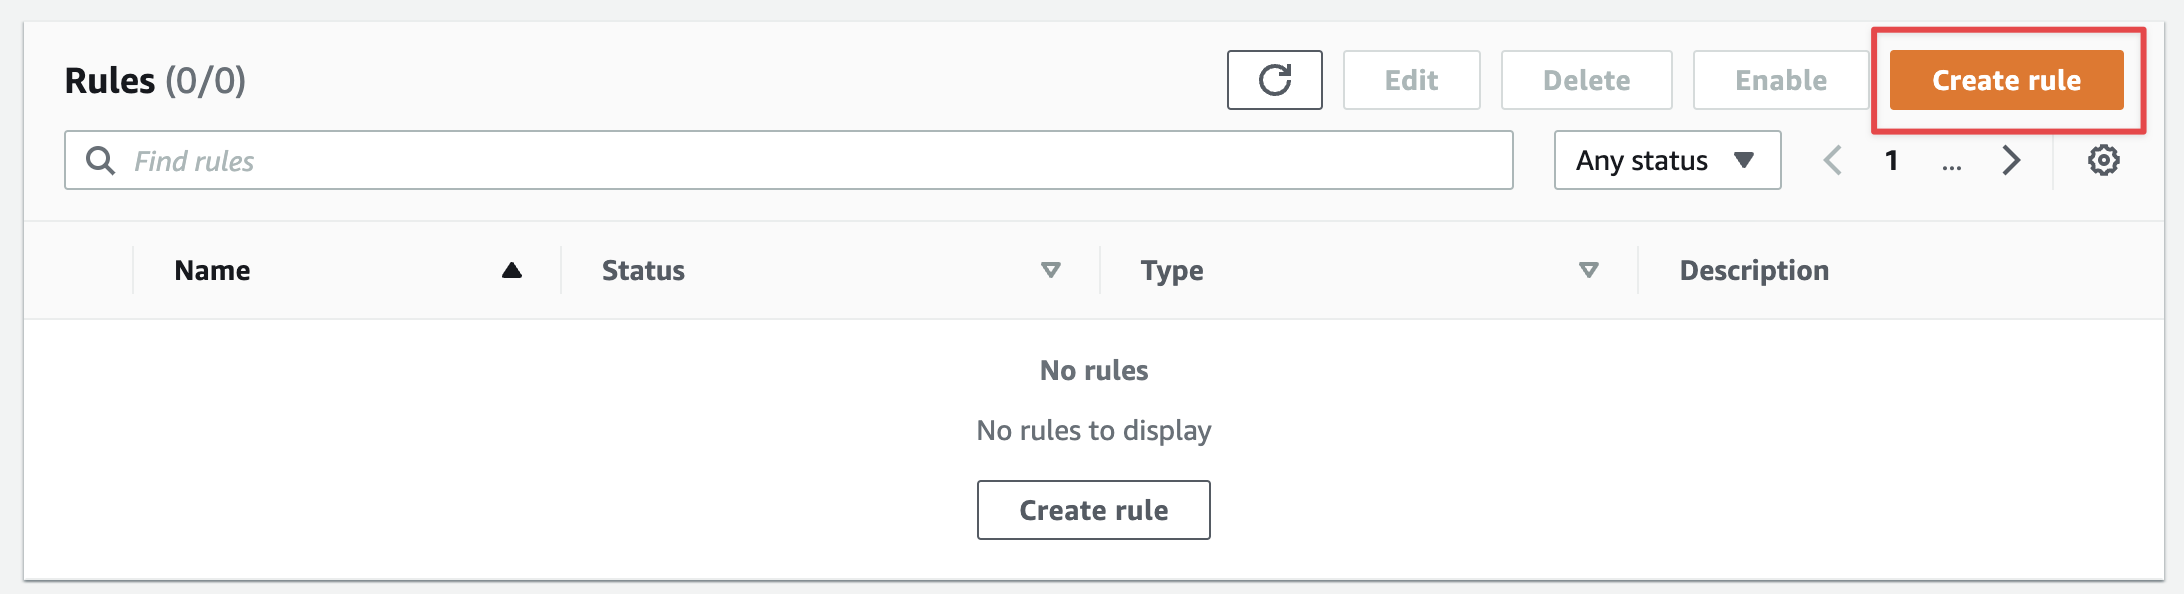
- From here, we can use Rules to configure where these logs should go. An easy destination would be CloudWatch.
Forward Logs From EventBridge To CloudWatch
- Create a CloudWatch log group. If you don't know how to do that, follow this tutorial. You must create this log group in the same AWS account you configured in Okta. It also needs to be in the same region as the EventBridge bus.
- Once the log group is created, go back to EventBridge and navigate to the Rules section.
- Make sure the correct event bus is selected from the menu and click on Create a Rule.
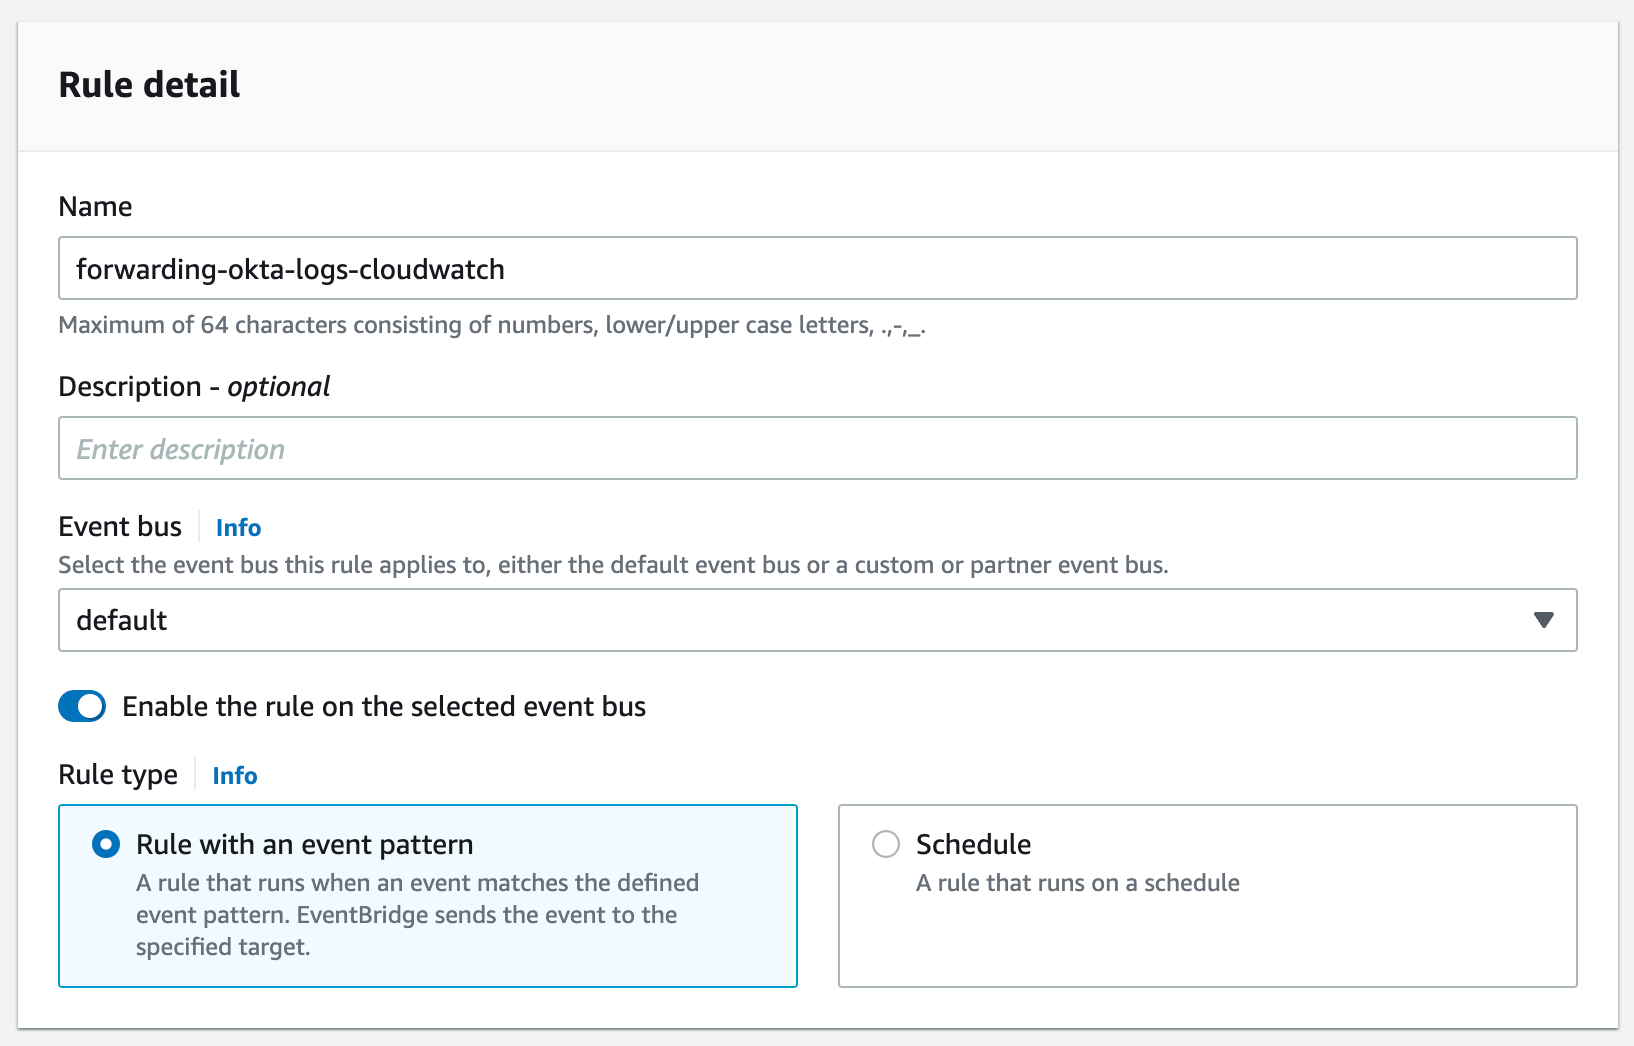
- In Step 1, give your rule a name and a description. Make sure the correct event bus is selected, that the "Enable the rule on the selected event bus" checkbox is checked, and that the rule type is "Rule with an event pattern". Hit next.
- In step 2, select "AWS events or EventBridge partner events" in the Event Source section.
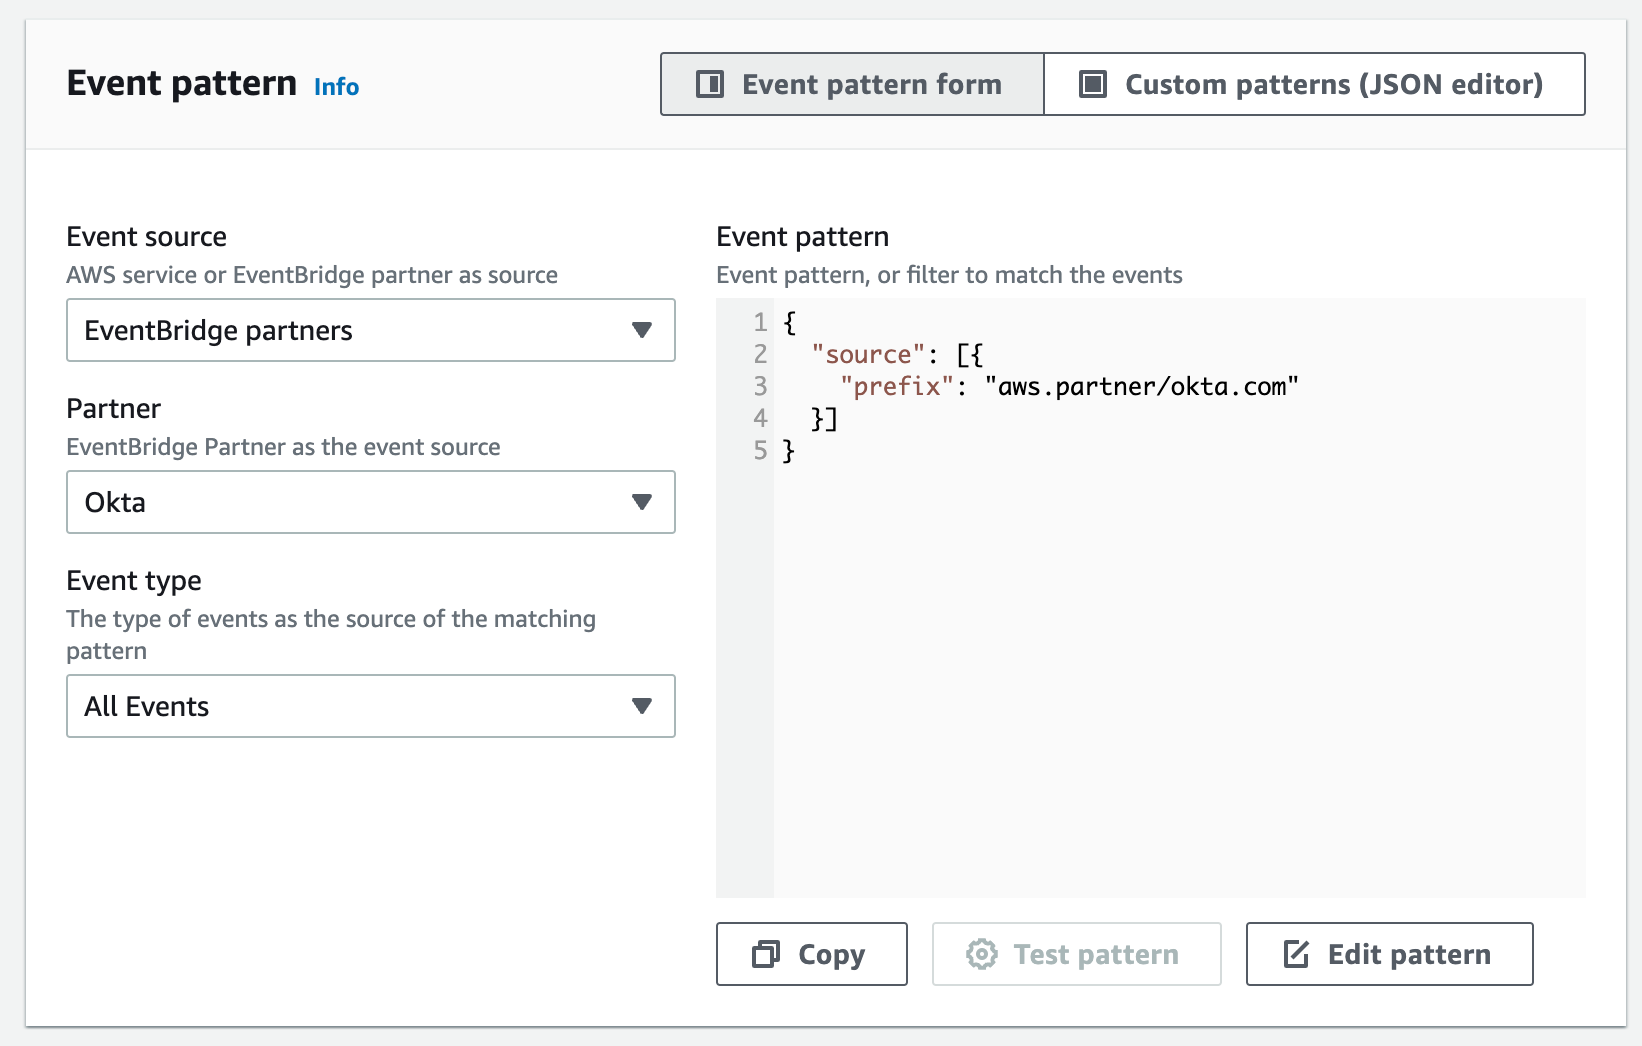
- Scroll down to the Event Pattern section. In the Event Source field, select EventBridge Partners. Select Okta in the Partner drop-down list and All Events in the Event Type list. Hit next.
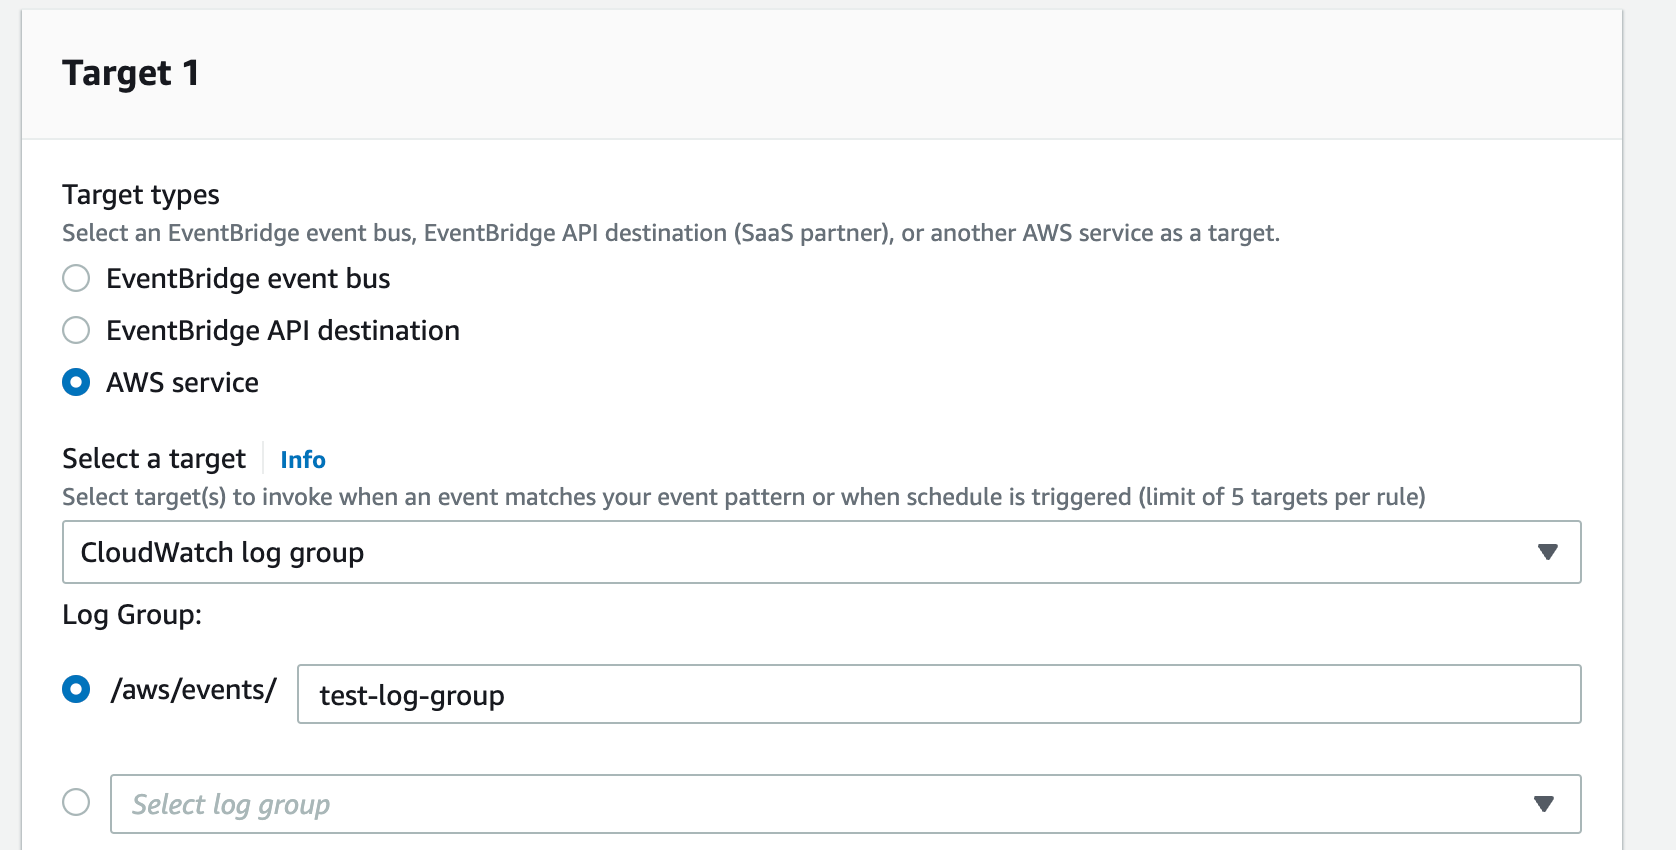
- In step 3, make sure AWS Services is selected in the target types field. Select CloudWatch log group from the dropdown list. Paste the name of the log group you created earlier into the text field below the dropdown list. You can also select it from the dropdown list below the text field. Leave everything else as it is. Hit next.
- In step 4, add tags.
- In step 5, review the configuration you created and once everything seems right, hit create rule.
- If everything was configured correctly, logs will start showing up in the log group within minutes of you creating the rule.
- You can forward these logs from CloudWatch to your log collector. Here are some tutorials for Splunk (link), ELK (link, link), and Datadog (link).
- Enjoy.

Forward Logs From EventBridge To Datadog
While I would love to detail how to configure the forwarding from CloudWatch to each of the three logging systems I mentioned, I don't have that much spare time at hand 😄. That being said, I love Datadog, so I will outline how to forward the logs there without even using CloudWatch at all.
Unlike many other systems, with Datadog, you can actually forward logs directly from EventBridge without the need for CloudWatch. Here is how you do it.
- Go the EventBridge Service. Navigate to API destinations under Integrations.
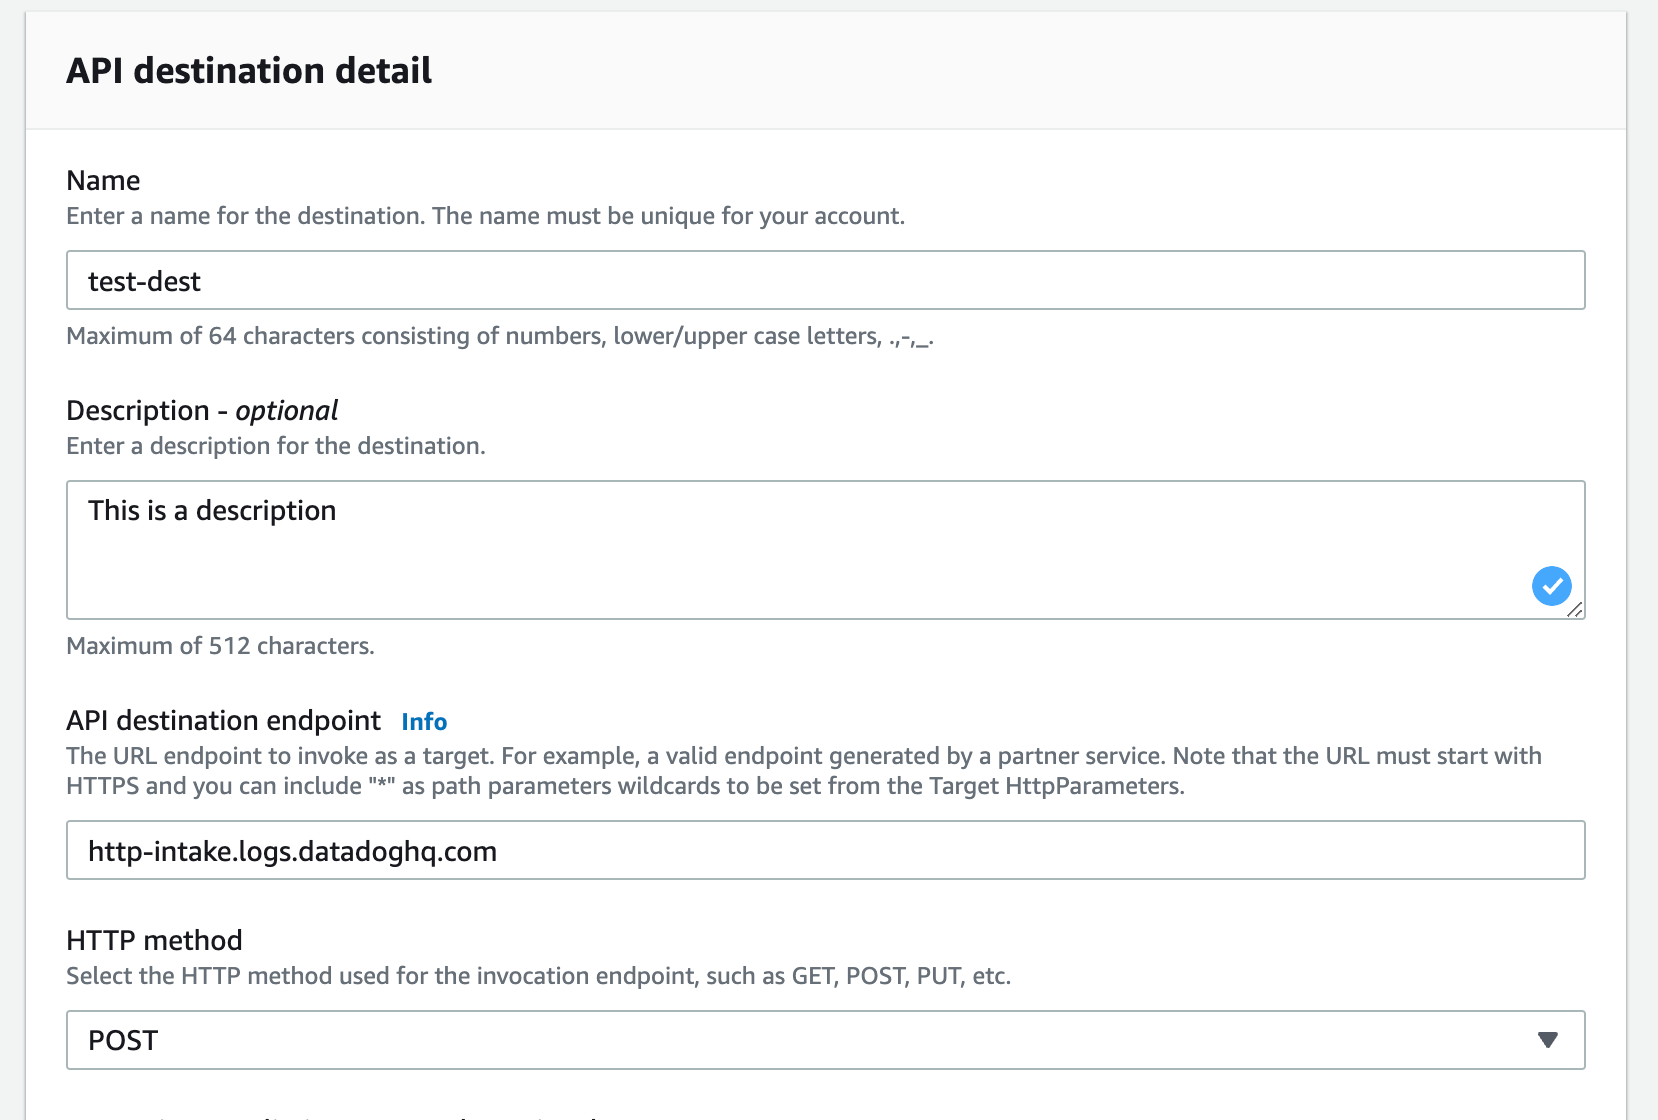
- Click on Create API destination. Give your new destination a name and a description.
- Set the HTTP method to POST.
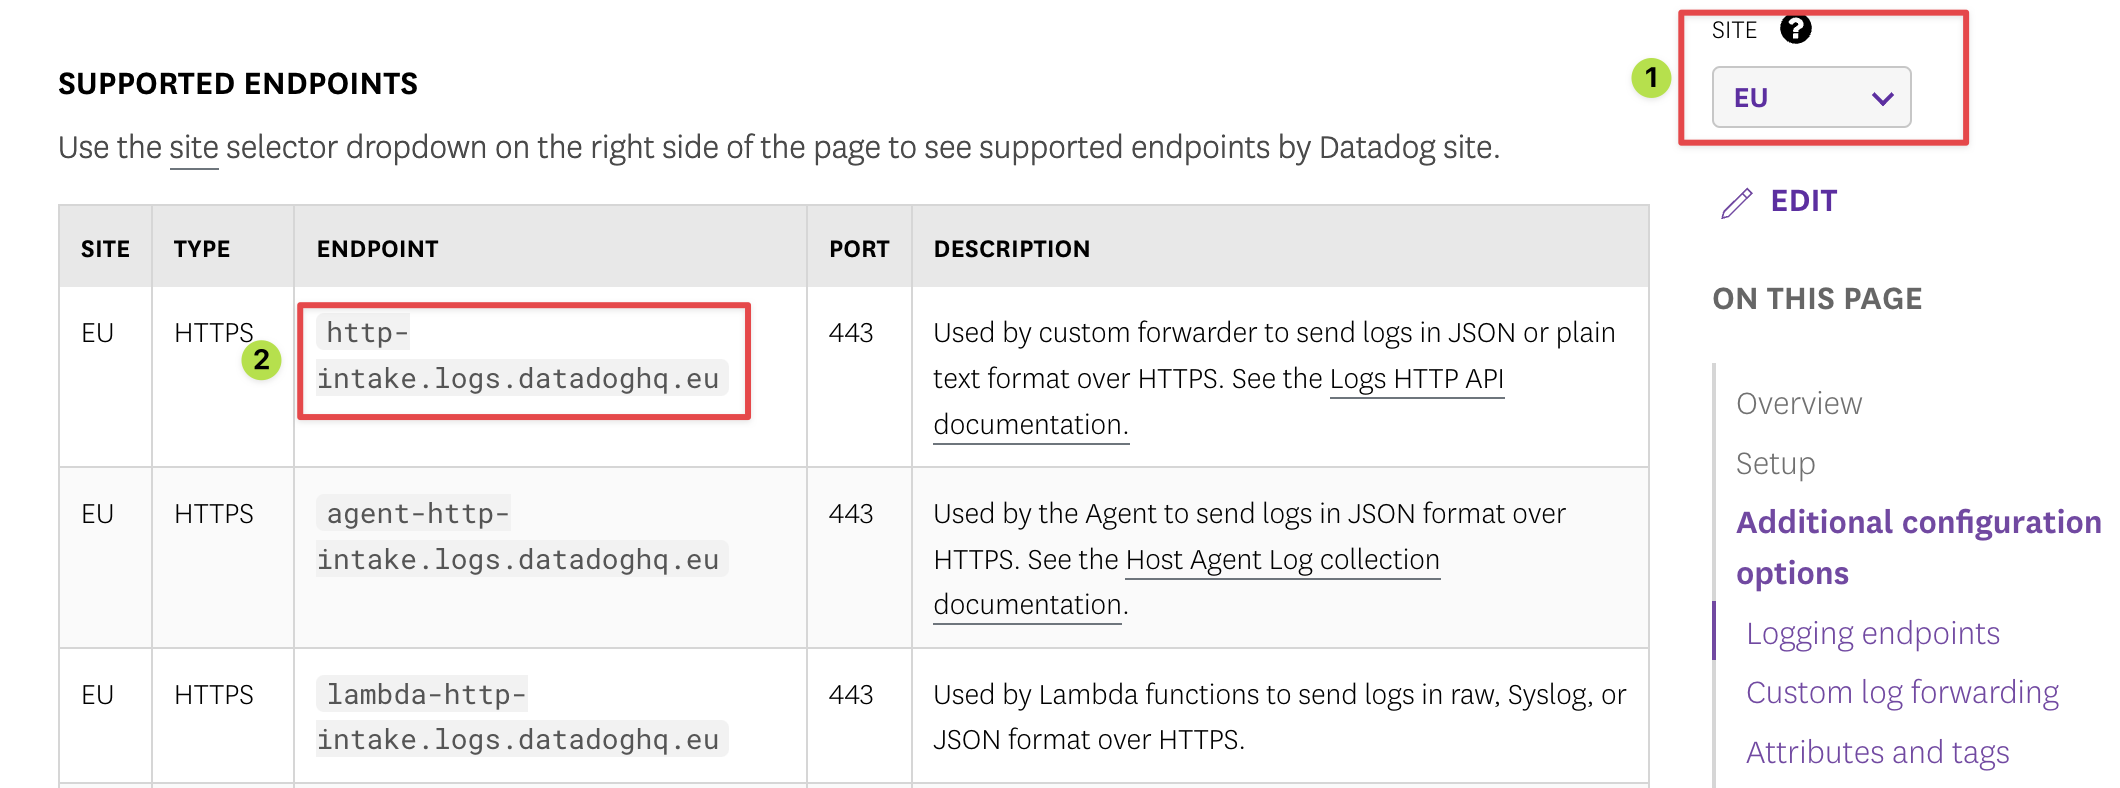
- The API destination endpoint depends on the region you are using for Datadog. Check this page. Select the correct region using the Site selector on the right-hand side of the page, and find the "http-intake.logs.datadoghq.*" URL for your region. Add that URL in the API destination endpoint field.
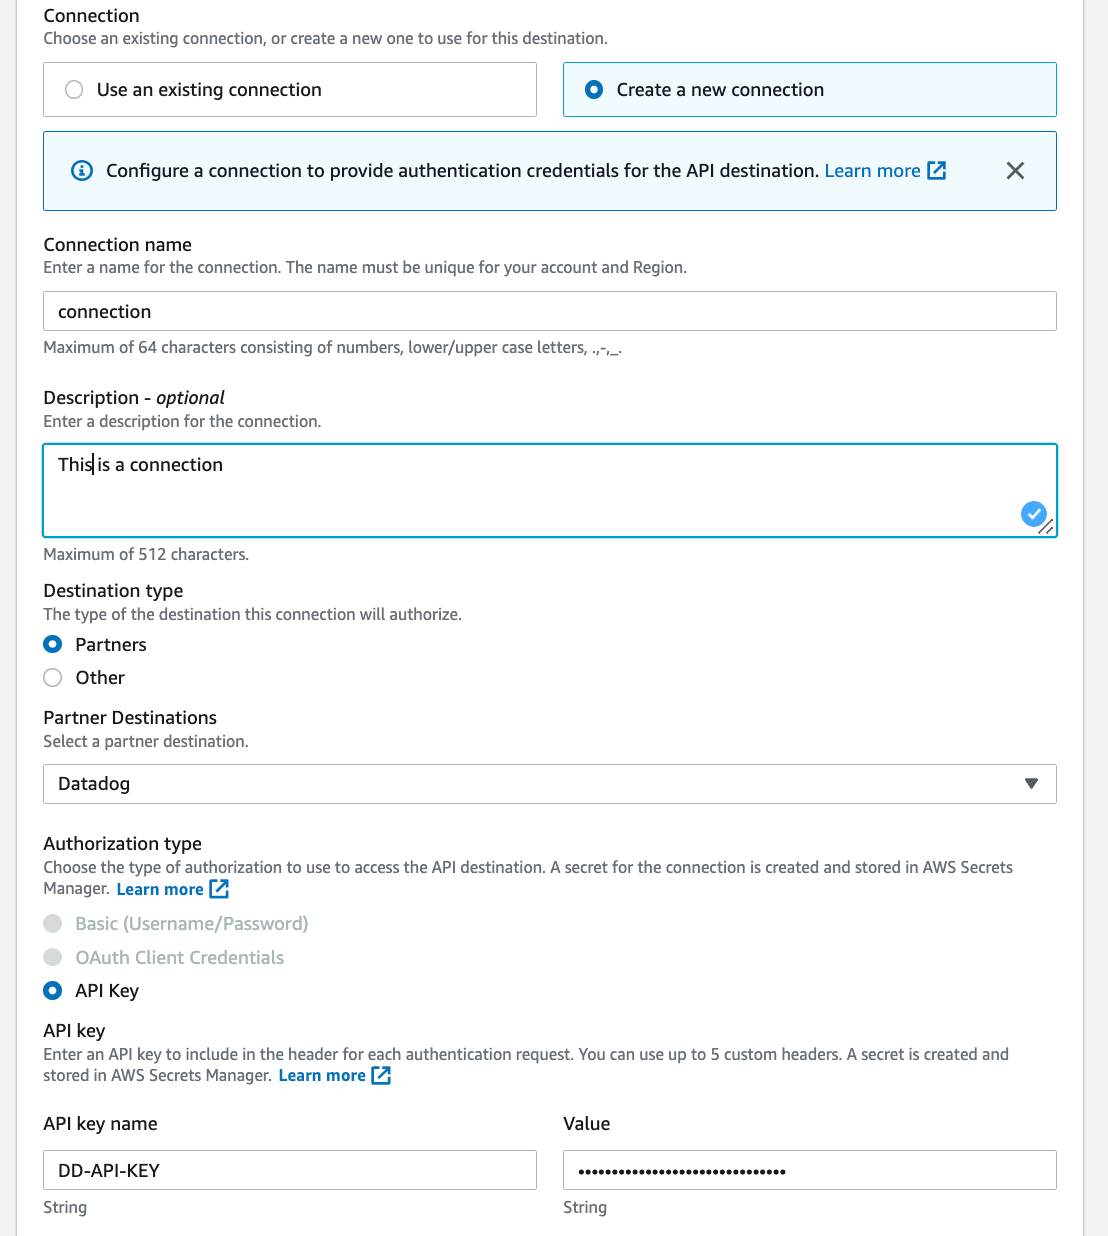
- In the connection section, Select Create a new connection. Give your new connection a name and a description.
- In the destination type, select Partners. Select Datadog from the Partner Destinations.
- API Key will be selected by default in the Authorization type. Put DD-API-KEY in the API Key Name field, and the actual key you created on Datadog in the value field.
- Hit create.
- Now that you have an API destination, go to Rules and create a new rule. Follow the same steps as we did for CloudWatch. The only difference is when configuration the target of the rule. Instead of selecting AWS Services, select EventBridge API destination.
- In the API destination section, select Use an existing destination, and select your newly created destination from the list.
- Leave the rest as it is. Complete the rest of the rule configuration following the same instructions outlined above for CloudWatch.
- If you configured everything correctly, you should have the logs in your Datadog account in like 5-10 minutes.
- Success 🎉🎉🎉
Epilogue
This is a really long post. I hope you find it useful. We went through the entire processing for how to stream Okta logs to AWS EventBridge, and from there to either CloudWatch or Datadog. Happy threat hunting!
Links
- https://help.okta.com/en/prod/Content/Topics/Reports/log-streaming/about-log-streams.htm
- https://help.okta.com/en/prod/Content/Topics/Reports/log-streaming/add-aws-eb-log-stream.htm
- https://help.okta.com/en/prod/Content/Topics/Reports/log-streaming/add-splunk-log-stream.htm
- https://developer.okta.com/docs/reference/api/log-streaming/
- https://logz.io/learn/definitive-guide-aws-log-analytics-elk/
- https://www.splunk.com/en_us/blog/tips-and-tricks/how-to-easily-stream-aws-cloudwatch-logs-to-splunk.html
- https://docs.datadoghq.com/logs/guide/sending-events-and-logs-to-datadog-with-amazon-eventbridge-api-destinations/
- https://support.okta.com/help/s/article/Exporting-Okta-Log-Data?language=en_US