Elasticsearch, Logstash, and Kibana (usually abbreviated as ELK) are three powerful open-source tools that are widely used for log collection, indexing, and analysis for all sorts of use cases and purposes. It's been a while since I spun an ELK instance so when I had to analyse some logs, I decided to give it another go. This short blog post outlines how to spin a local instance, load your data, and offers some pointers on how to analyse Okta logs using KQL and Sigma rules.
Spin A Local ELK Instance
You only need to do this if you don't have an operative ELK instance already. I just use the docker-elk project to spin local instances whenever I need one.
- Install docker and docker-compose.
- Clone the repo:
git clone https://github.com/deviantony/docker-elk.git - Switch to the docker-elk directory.
- Run
docker-compose up
Increase File Size Limit
- Login to Kibana (http://localhost:5601/) using the default username and password (reset them if you plan to keep this instance for a while).
- Navigate to http://localhost:5601/app/management/kibana/settings
- Scroll down until you find Maximum file upload size, set it to a number larger than the size of your log file.

Import Your Logs
Uploading your logs is ridiculously easy, specially if they are in a CSV file. Here are the steps:
- Navigate to http://localhost:5601/app/integrations/browse/upload_file
- Click on Upload A File
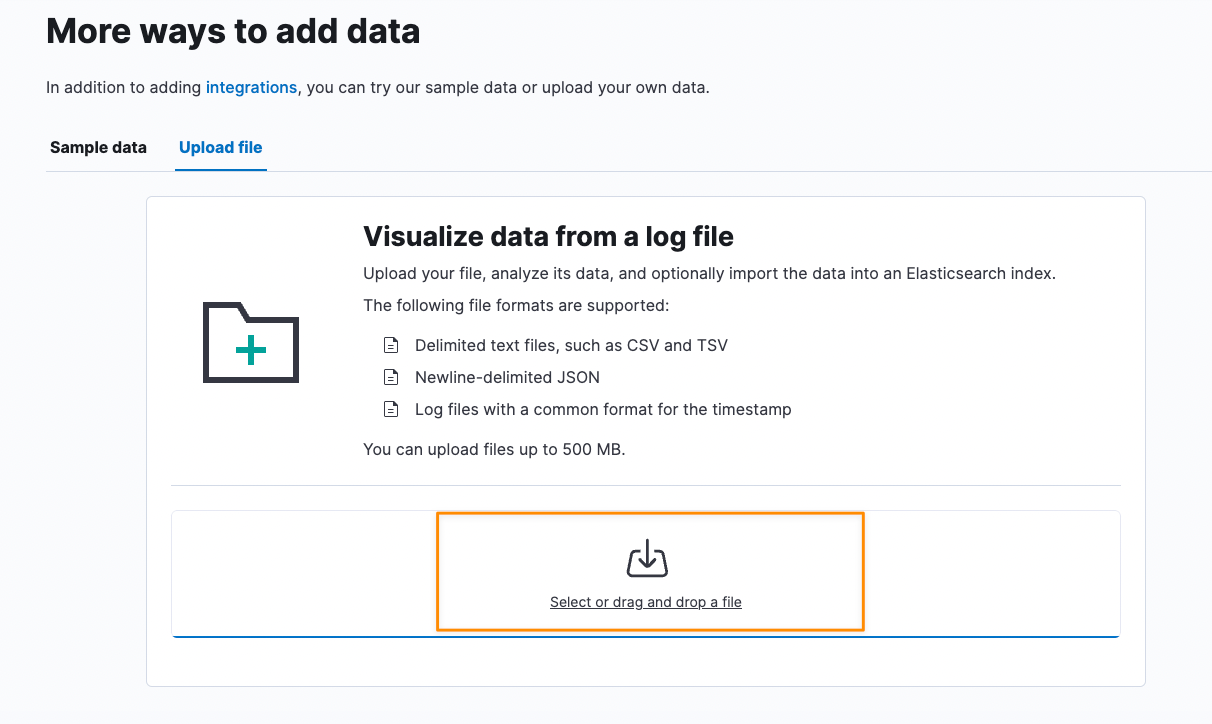
- Click on "Select or drag and drop a file" to open the File Selection window. Choose the file you want to upload and click Open

- The system will take a moment to parse your file and once it's done, it will show you some stats about the different fields and how much data coverage there is for each field. Click on the Import button in the lower left-hand corner to proceed with the data import.
- You will be asked to provide an index name before the import is complete. Once you click import, it will take some time –based on how much data you are importing– to complete the process.

- Click on View Data in Discover to see your imported data in the Discover tab, from there, you can search and analyse it using the KQL or maybe build some visualizations.
Example: Analysing Okta Logs
Many blue teams are having a rough week after the news of the security breach affecting Okta (and other companies). One good advice that's been circulating online is to download the system logs from Okta (as they are rotated in a 90-days window) and review them for any malicious or suspicious activity.
Okta logs a lot of information and the logs for three months could easily be in the hundreds of thousands (if not millions) of entries. You could use ELK to import these logs and run all the important queries on the data in a simple and plainless manner. Follow the same steps I outlined above, and you should end up with a local instance that has all of your logs ready for analysis.
A couple of people on Twitter pointed out that Sigma (a Generic Signature Format for SIEM Systems) has some good queries that can help you find suspicious or malicious activity in your Okta logs. You could either use sigmac to convert these queries into KQL queries that can be executed in your ELK instance, or you can use uncoder.io to do that via a web browser.
Final Thoughts
There are many tools available for log analysis, but I really like the simplicity and friendly user-experience provided by ELK and how easy it is to spin a local instance, load the data and perform all types of analysis on it.
Links
- https://www.elastic.co/what-is/elk-stack
- https://github.com/SigmaHQ/sigma
- https://elk-docker.readthedocs.io/
- https://uncoder.io/


